Energy Monitoring with a Raspberry Pi
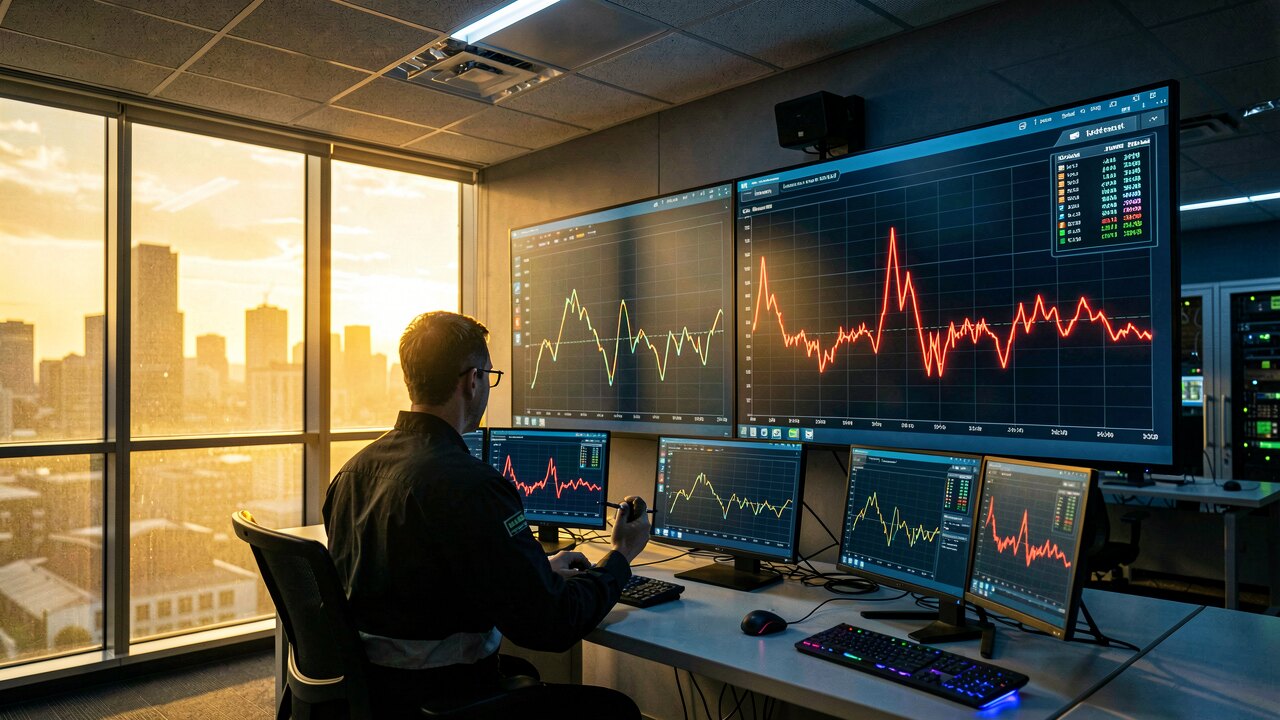
Yes — a Raspberry Pi can run a full energy monitoring system. It reads live data from meters or sensors, stores it, and shows your consumption on a dashboard you host yourself.
Three things: a Raspberry Pi (any model with network, a Pi 3/4/5 or Zero 2 W works), a way to read your energy data, and monitoring software. The data source is the key decision — you can read a smart meter's optical/IR interface (SML/DLMS), pull Modbus/SunSpec data from an inverter or meter, or clamp current transformer (CT) sensors around your cables. The Pi stores the readings and serves the dashboard.
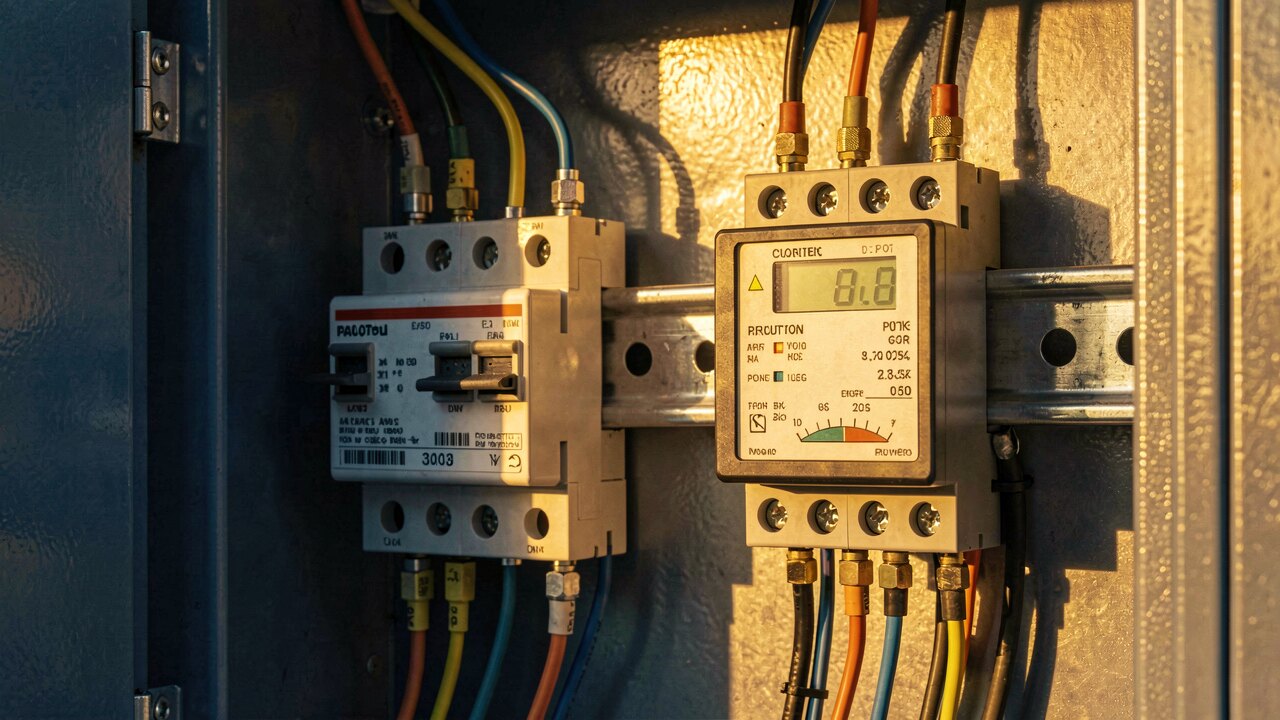
1) Flash Raspberry Pi OS to an SD card and connect the Pi to your network. 2) Attach your reader: a USB IR read-head on the smart meter, a USB-RS485 adapter for Modbus devices, or an ADC/CT board for direct current sensing. 3) Install monitoring software that polls the device on an interval. 4) Write each reading to a time-series database. 5) Open the dashboard in your browser to see live power, daily kWh, and trends.
Common self-hosted stacks: Home Assistant with an energy dashboard for a plug-and-play route; or a custom pipeline that pushes readings into a time-series database (InfluxDB, ClickHouse) and visualises them in Grafana. Data is collected by a small poller script or an integration that speaks your meter's protocol (SML, Modbus, MQTT). The Pi handles polling, storage, and web serving on one low-power device.
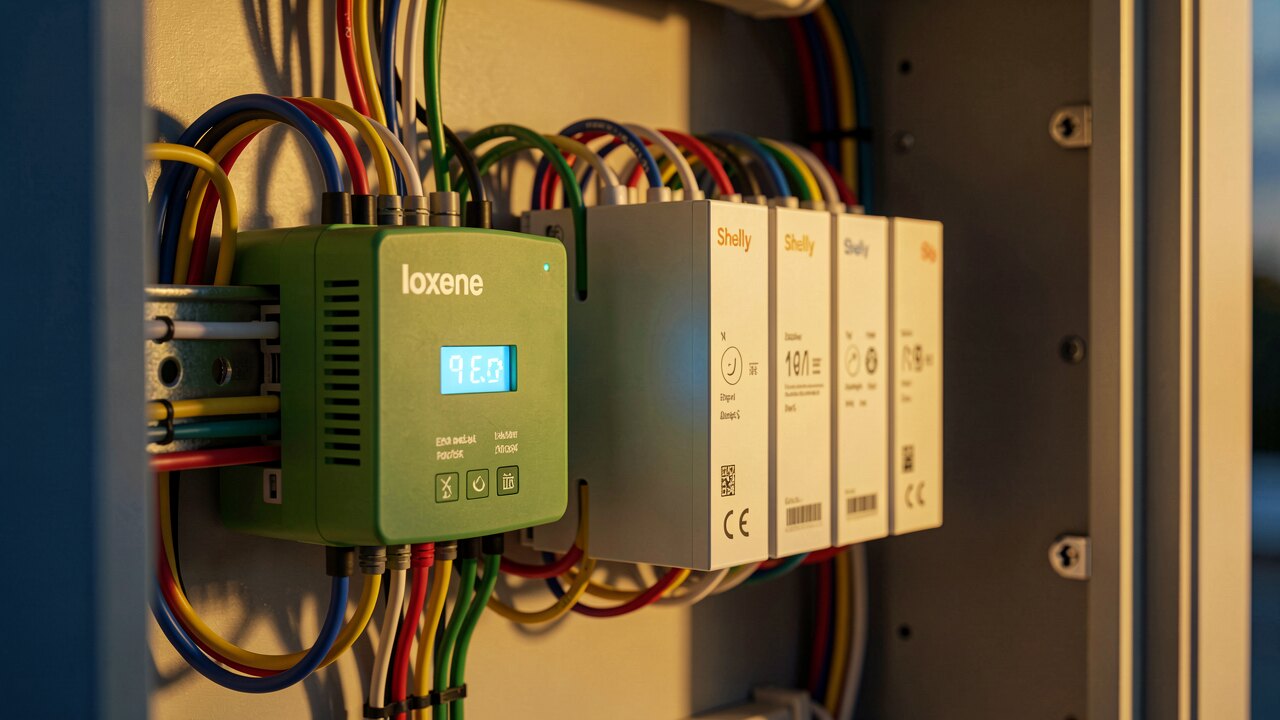
If your meter has an optical interface (many modern German meters send SML via IR), a USB read-head gives you exact, billed values with no wiring in the fuse box. Clamp-on CT sensors are non-invasive too but only estimate power from current — they don't see power factor unless paired with voltage sensing, so readings are approximate. For accurate consumption figures, prefer the meter interface or a certified sub-meter over bare CTs.
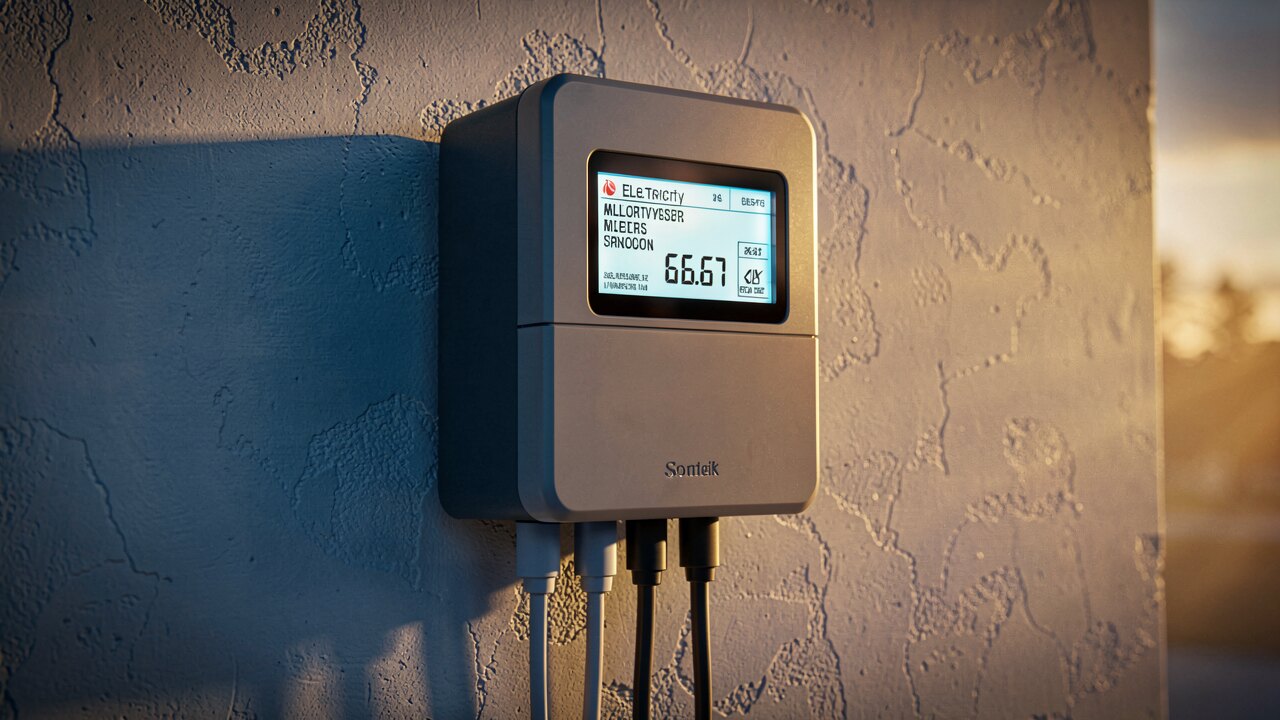
A Pi is excellent for a home, a single machine, or one measuring point. For many meters, multiple sites, or utility-grade analysis (grid-quality, peak-load, reactive power), the Pi is best used as an edge collector that forwards data to a central server. That is exactly how professional setups run: the Pi sits at the site and reads the meter, while heavy storage and analytics live centrally.
A live view of your consumption lets you spot inefficient appliances, standby drains, and load peaks you would otherwise never see. Continuous monitoring turns a monthly bill into an actionable signal — you find where energy (and money) is wasted and can act on it. For heat pumps, EV charging, or PV self-consumption, per-device visibility is where the savings come from.