Real-Time Energy Monitoring in Ireland: Reading Every Asset Live
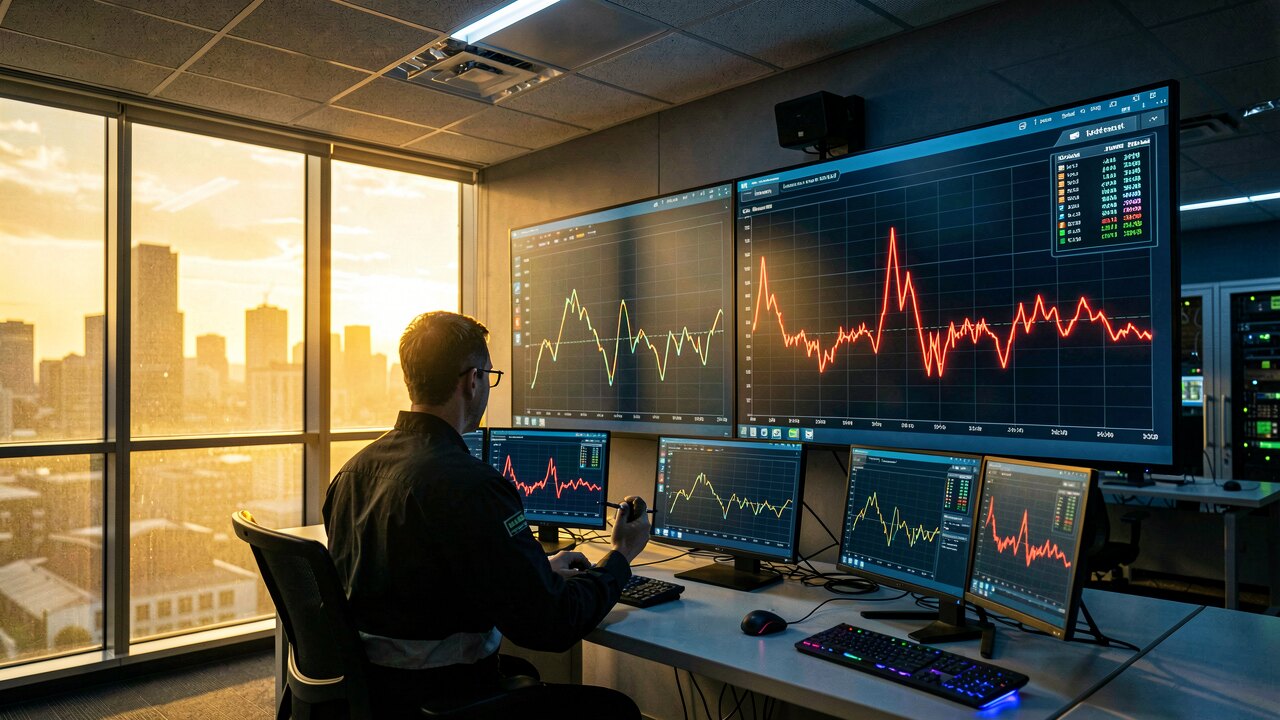
Real-time energy monitoring means each asset — every meter, motor, HVAC unit, PV inverter and battery — is read continuously and shown live, second by second, instead of once a month on a bill. In Ireland this sits on top of your ESB Networks connection, while EirGrid balances the wider grid.
Instead of one whole-building figure, a metering point (CT clamp, Modbus meter or sub-meter) is placed on each asset. Values — active power (kW), current, voltage, power factor and cumulative kWh — are sampled at short intervals (typically seconds to a few minutes) and streamed to a dashboard. You see, in real time, exactly which line, machine or feeder is drawing or generating power right now, not an averaged monthly total.
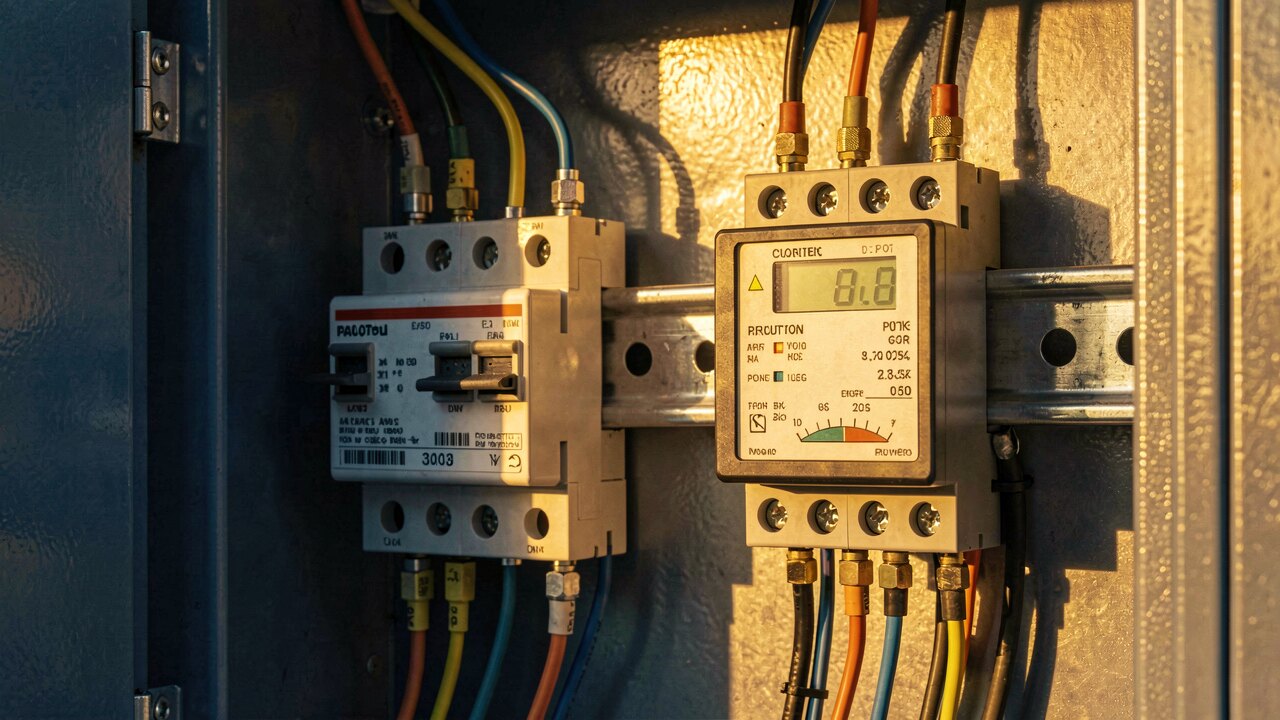
1) List the assets you want visibility on (main incomer, key motors, HVAC, refrigeration, PV, battery). 2) Fit metering on each: revenue reads stay with the ESB Networks meter; asset reads come from sub-meters or CT sensors you install downstream. 3) Connect the sensors over Modbus/SunSpec or a data logger to a gateway. 4) Stream to a live dashboard with alarms. 5) Baseline the first weeks, then act on the peaks and idle loads it exposes.
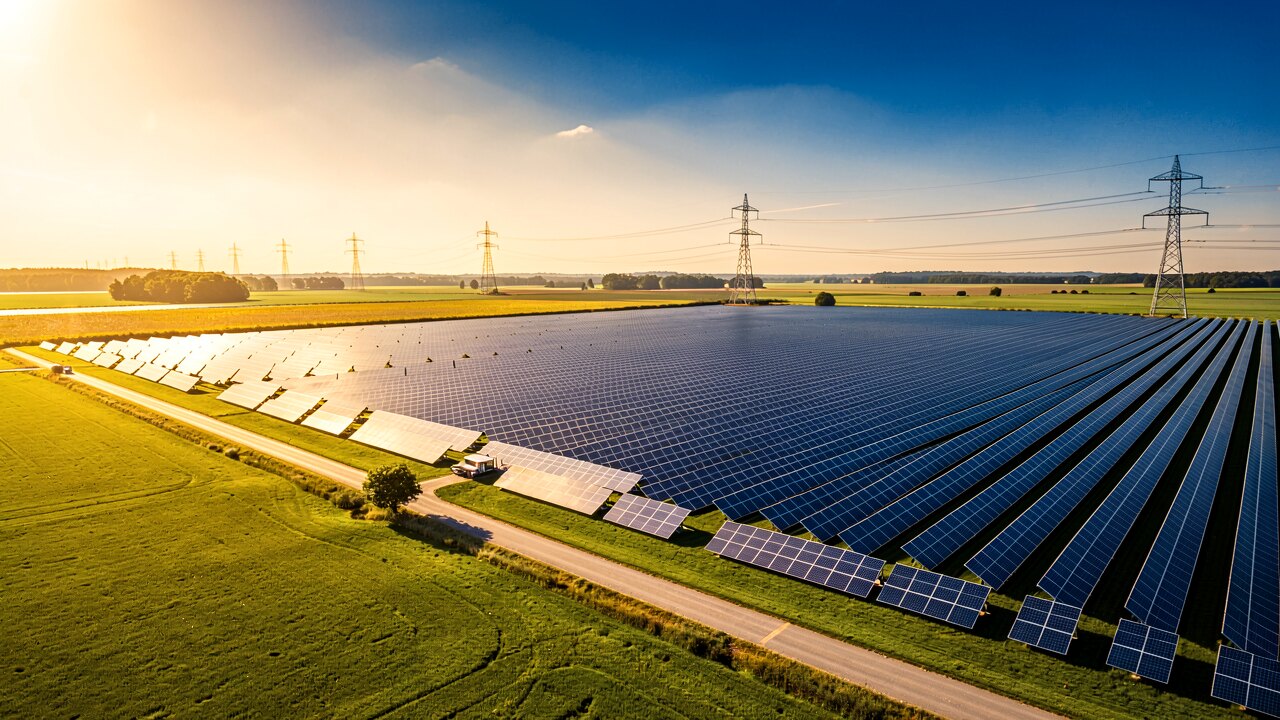
In Ireland the distribution network and your connection meter are operated by ESB Networks; EirGrid is the transmission system operator balancing generation and demand nationally. The national smart-meter rollout gives ESB Networks half-hourly (and finer) interval data for billing, but that data reaches you after the fact. Asset-level monitoring is your own layer on top: it is granular and truly live, so it complements rather than replaces the official ESB Networks meter.
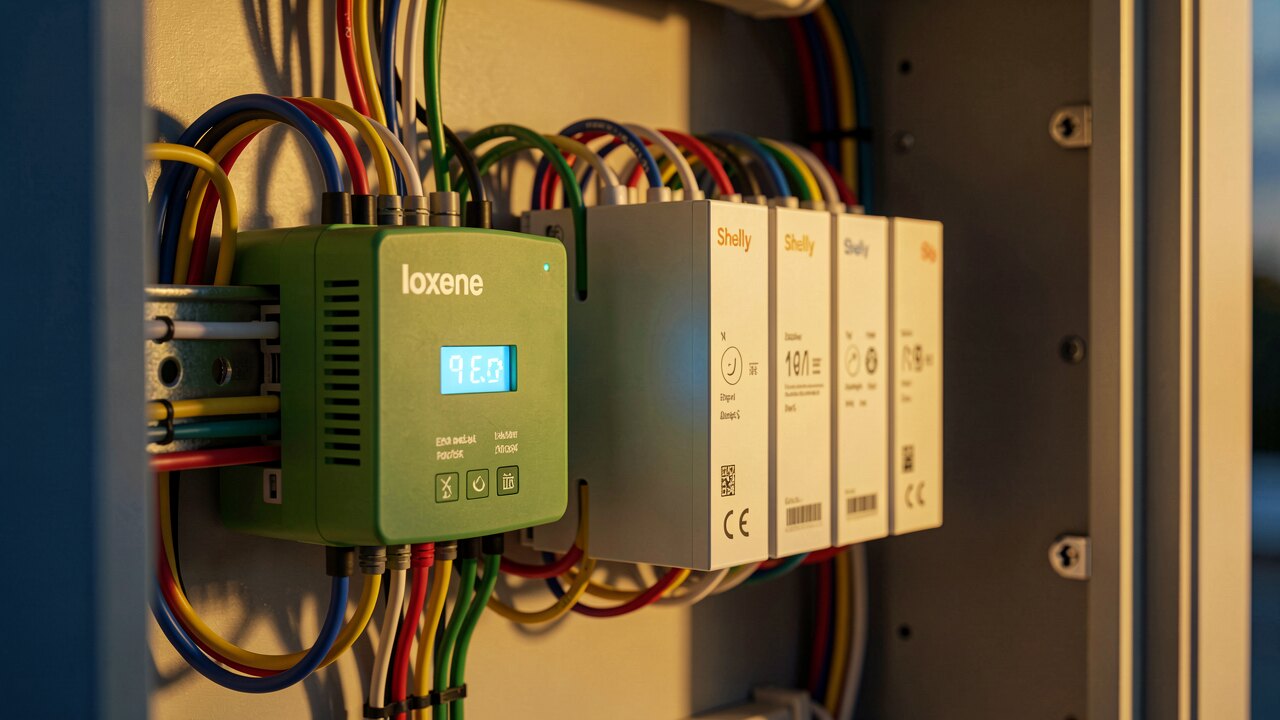
Live per-asset reads make three things possible: (a) peak-load / maximum-demand management — spot and shave the kW peaks that drive network charges; (b) drive and power-quality analysis — catch failing motors, poor power factor and imbalance early; and (c) verification — check that a PV or battery asset is actually producing what it should. Because it is continuous, you find drift and faults in hours, not at the next bill.
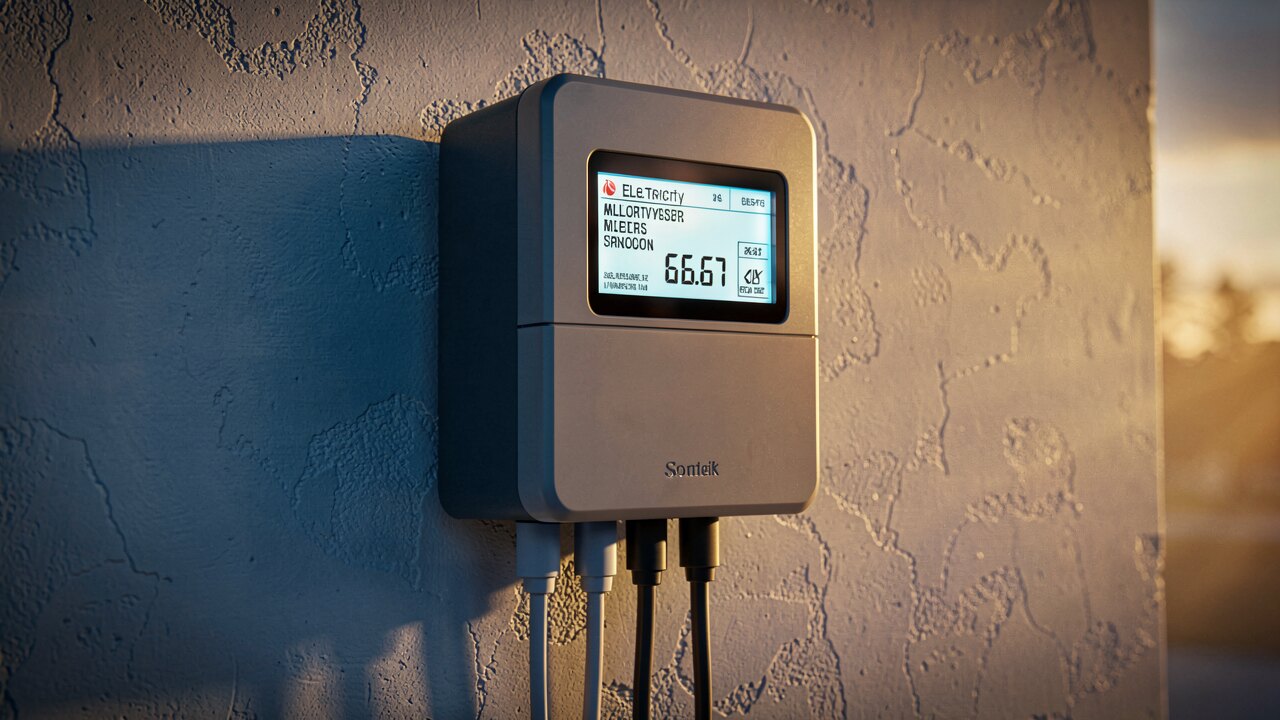
The ESB Networks meter is the settlement (money) reading and stays authoritative for your bill. Your sub-meters and sensors are the diagnostic reading — higher resolution, per asset, and yours to log freely. They will not perfectly match the utility meter to the last watt (different points, timing, and accuracy classes), and that is expected: use the utility figure for billing checks and the live sub-meter data to understand behaviour.
Commercial buildings, agri and food-processing sites, and island/self-contained networks tend to see the fastest return, because their maximum-demand charges and process loads are large and swing hard. Start monitoring the biggest and most variable assets first — the incomer, refrigeration/HVAC and any PV or storage — since that is where live visibility turns straight into avoided peaks and caught faults.
 Live prices & arbitrage · stromfee.ai
 Charge Director
 Automixer
 BESS Engineer
 PV Watcher
 Academy