What Are Energy Monitoring Systems?
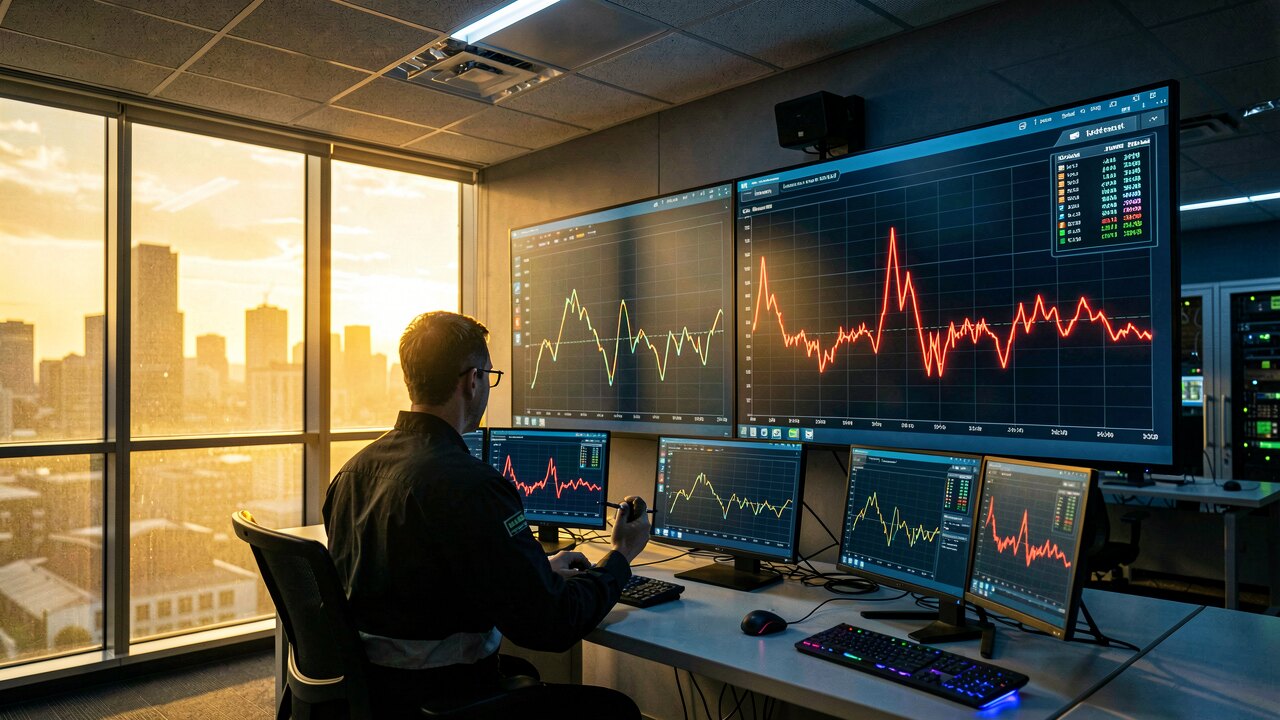
An energy monitoring system is a combination of meters, sensors, and software that continuously records how much energy you use, when, and where. It turns raw consumption into a live picture on a dashboard, so you can see inefficiencies instead of guessing at them.
At its core, an energy monitoring system measures electricity (and often gas, heat, or water) at the point of use and makes that data visible in near real time. It answers three questions you cannot see from a monthly utility bill: how much is consumed, at what times peaks occur, and which machines, circuits, or buildings are responsible. Everything else—alerts, reports, optimization—builds on that measured data.
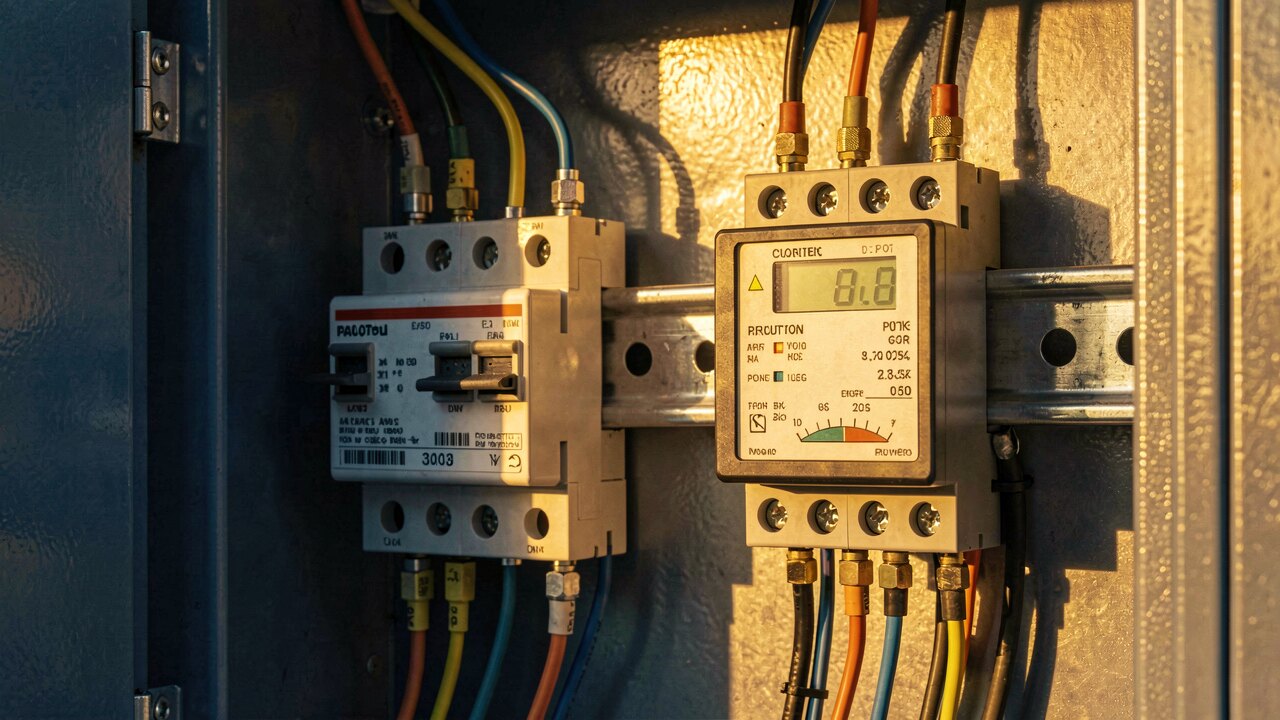
A typical setup has three layers. Meters and current sensors sit on your circuits or main feed and record consumption at short intervals. A gateway or logger collects those readings and sends them onward. Software then stores, visualizes, and analyzes the data on a dashboard, showing load curves, comparisons over time, and anomalies. Because the data is continuous rather than a single monthly total, you can spot standby loads, night-time consumption, and demand peaks as they happen.
You cannot target savings if you do not know when and where energy is used. Monitoring provides the data foundation for every later step—identifying inefficient equipment or processes, verifying that a change actually reduced consumption, and avoiding costly demand peaks. Transparency over consumption is the first, unavoidable step toward cutting costs; optimization without it is guesswork.
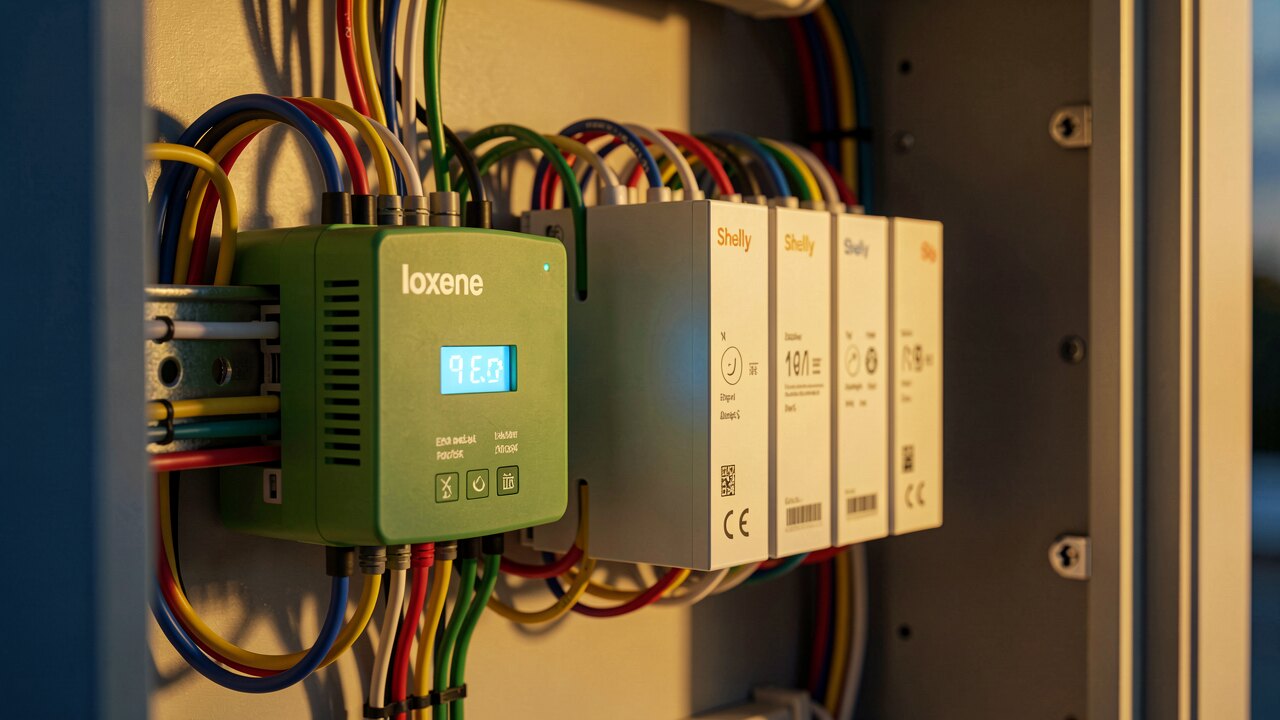
Depending on the sensors you install, a system can track total site consumption, individual buildings, production lines, or single machines. Common metrics include real-time power draw, energy used over a period, load profiles across the day, and peak demand. Many systems also let you compare periods (this week vs. last), set thresholds, and receive alerts when consumption behaves unexpectedly.
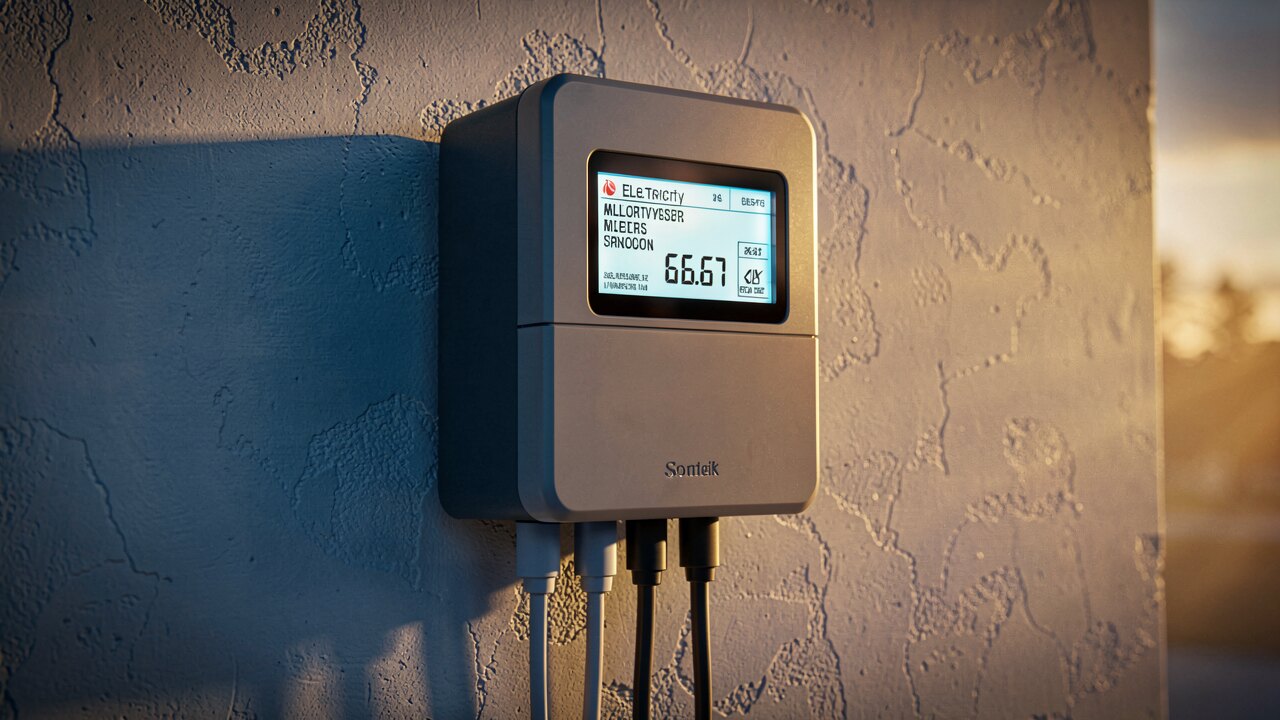
You do not need a large project to begin. First, analysis: review your existing infrastructure and define what you actually want to see and improve. Second, implementation: install the meters and sensors and integrate them with the monitoring software. Third, ongoing use: read the dashboard regularly, identify optimization opportunities, and confirm that changes work by watching the data. Start with the areas where you suspect the most waste and expand from there.
Match the system to your goal and scale. For a single building, a few meters on the main feed and key circuits may be enough; for a production site, you will want per-machine or per-line measurement. Check that it supports the utilities you care about (power, and optionally gas, heat, water), integrates with your existing meters, and presents data in a dashboard your team will actually use. The right system is the one whose data leads to decisions, not just charts.
Ein Energy Monitoring System — auf Deutsch Energiemonitoring-System — ist die Messtechnik plus Software, die deinen Energieverbrauch dauerhaft erfasst, speichert und auswertbar macht. Es besteht immer aus drei Teilen: Sensorik am Zähler oder Abgang (Stromwandler, Impulsausgang, Modbus-Schnittstelle des Zählers), einer Übertragung ins Netz (LAN, Mobilfunk, LoRa) und einer Auswertung, die aus den Rohwerten Lastgänge, Kennzahlen und Alarme macht. Der Unterschied zum normalen Zähler ist die Auflösung und die Historie: Ein Abrechnungszähler liefert dir eine Jahressumme, ein Monitoring-System liefert dir Werte im Minuten- oder 15-Minuten-Takt, dauerhaft gespeichert. Erst damit siehst du, wann ein Verbrauch entsteht — und nicht nur, dass er entstanden ist.
Praktisch gehst du in vier Schritten vor. Erstens: Messpunkte festlegen — Übergabepunkt zum Netzbetreiber immer, dann die großen Abgänge (Produktionslinie, Kälte, Druckluft, Lüftung, Ladeinfrastruktur). Zweitens: Messtechnik wählen, die neben kWh auch Wirk-, Blind- und Scheinleistung sowie cosφ ausgibt — sonst siehst du Lastspitzen und Blindarbeit nicht, obwohl beide auf deiner Rechnung stehen. Drittens: Daten dauerhaft wegschreiben, nicht nur im Gerät puffern; ein Monitoring ohne Historie kann keine Vorher-Nachher-Aussage treffen. Viertens: definieren, worauf das System reagieren soll — Lastspitze über Schwelle, ungewöhnlicher Nachtverbrauch, Grundlast am Wochenende. Zwei Punkte, die du vorher wissen solltest: Ein Monitoring-System ist in aller Regel nicht eichrechtskonform, es ersetzt also keinen Abrechnungszähler, sondern erklärt ihn. Und es spart selbst kein Kilowatt — es zeigt dir nur, wo eines zu holen ist; sparen tut erst die Maßnahme, die du daraus ableitest.