What continuous energy data capture delivers
A digital energy diary records consumption continuously, recognizes patterns and raises an alarm when values deviate from the expected range. This shifts energy management from occasional meter readings to an ongoing record you can act on.
The core value is the combination of live data and historical analysis. Real-time readings show what is happening now, while the history explains whether that reading is normal — together they form the foundation for any deliberate energy optimization, in a business or a home.
One dashboard for the whole energy infrastructure
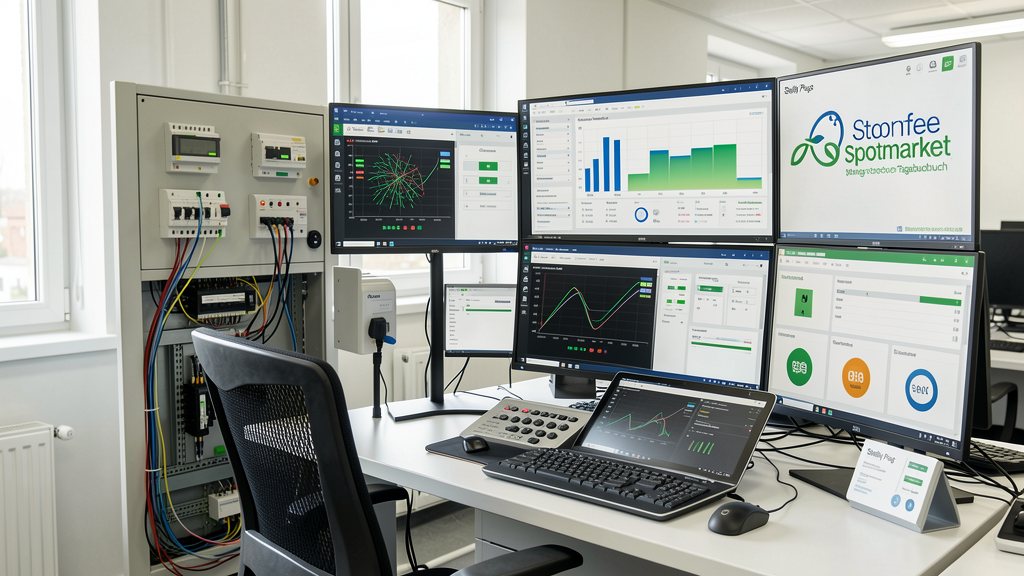
With the Stromfee Diary you get a detailed dashboard in which all relevant energy consumption data is shown visually. Instead of isolated readings per device, the picture is centralized.
This lets you monitor your entire energy infrastructure from one place — from combined heat and power (CHP) units and PV systems through to machine drives. Capturing and analyzing energy data across these sources continuously is what makes central oversight possible.
From raw readings to transparency and anomaly detection
The purpose of capturing the data is to make consumption transparent, detect anomalies, increase energy efficiency and reduce costs. Transparency is the first step: you cannot manage what you do not measure.
Because the diary compares incoming data against established patterns, unusual behavior surfaces as a deviation rather than staying hidden in a monthly bill. Artificial intelligence keeps the picture current, so the analysis reflects the latest state rather than a snapshot from weeks ago.
Turning captured data into cost decisions
Recorded energy data becomes most useful when it is tied to price. The Stromfee Diary added functions for analyzing energy prices, making it easier to analyze and compare received data — particularly in view of the dynamic development of prices.
This connects consumption data to market conditions. In combination with Loxone's Spotpriceoptimizer, the Stromfee Diary is used to optimize energy costs, so the data you capture feeds directly into when and how energy is used.
Grid analysis alongside consumption capture
Beyond consumption, Stromfee offers grid analysis (Netzanalyse) of feed-in and supply systems. This extends data capture from what you consume to how your installation interacts with the grid.
For operators of feed-in and supply systems, a continuous grid analysis provides a fuller record than consumption metering alone, which matters where generation and supply are part of the same site.
FAQ
What does capturing energy data actually mean?
It means recording consumption — and, where relevant, generation and feed-in — continuously rather than through occasional readings. The Stromfee Diary captures verbrauch data on an ongoing basis, recognizes patterns and flags deviations.
Which systems can be monitored at once?
The Stromfee Diary shows all relevant energy consumption data in one dashboard and lets you monitor the entire energy infrastructure centrally — from CHP units and PV systems to machine drives.
How does AI help with the captured data?
Artificial intelligence keeps the analysis up to date and supports detecting anomalies, so unusual consumption stands out against established patterns instead of being noticed only later.
How does captured data help reduce costs?
The diary includes functions to analyze and compare energy prices against the dynamic market. Combined with Loxone's Spotpriceoptimizer, this consumption data is used to optimize energy costs.