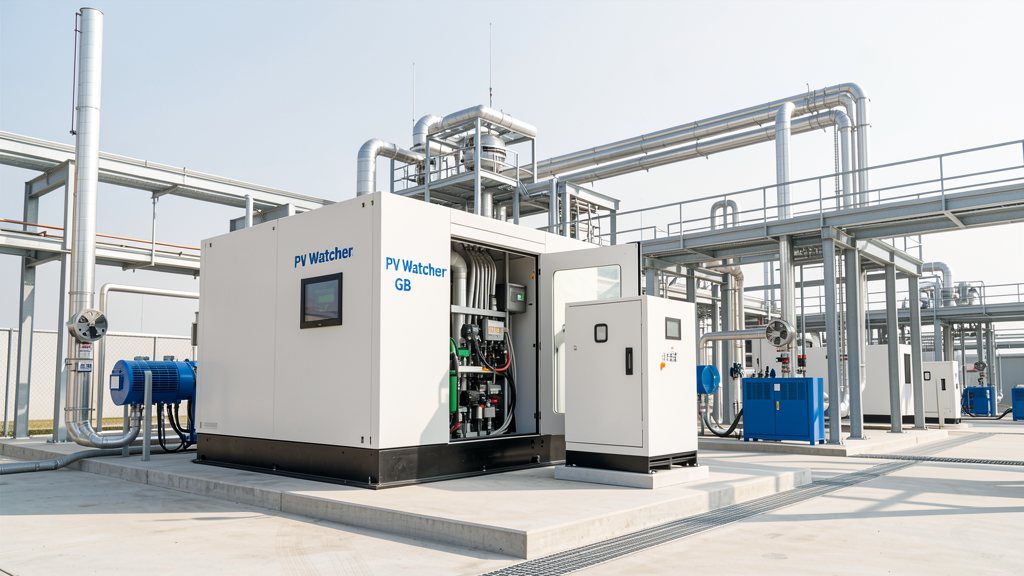
PV Watcher GB: your solar asset protected when prices collapse
The growth of renewable generation in Great Britain has transformed the wholesale electricity market in ways that many solar PV asset owners did not anticipate when their projects were conceived. Negative-price settlement periods in the GB day-ahead market — virtually unknown before 2022 — reached approximately 139–149 hours in 2024, a roughly six-fold increase compared with two years earlier ENTSO-E Transparency Platform — GB day-ahead half-hourly price data. Analysts project that this figure will continue to rise as solar and wind capacity additions outpace network reinforcement and storage deployment. These negative-price episodes cluster around midday periods of high solar output and low demand, particularly on mild, sunny days in spring and summer — exactly when a grid-scale PV installation is generating at or near peak capacity. For generators operating under a Contract for Difference (CfD), the commercial consequences depend critically on which allocation round the contract falls under. Under AR4 contracts (from the 2022 auction onward) and all subsequent rounds, the CfD difference payment is suspended for any single half-hourly settlement period in which the day-ahead reference price is negative — there is no minimum duration threshold Frontier Economics — Impact of Negative Pricing on Renewable Support: CfD AR2/AR3 six-consecutive-period rule vs AR4 instant suspension. Under the legacy Renewables Obligation (RO) scheme, running until 2037, no equivalent suspension mechanism exists, but operators face the different challenge of managing generation economics at negative prices without ROC revenue protection. Understanding which regime your installation operates under, monitoring every negative-price event in real time, and quantifying its financial impact is what PV Watcher GB provides. Explore the full regulatory framework at /gb/rules/ and historical curtailment events at /gb/blackouts/.
The GB negative-price mechanism: CfD allocation rounds and the RO legacy
Unlike the German §51 EEG mechanism — which suspends the market premium when the spot price is negative for six or more consecutive hours — the GB approach to negative-price protection in renewable support schemes has evolved significantly across CfD allocation rounds and varies materially depending on when a project was contracted. Understanding the precise rule that applies to a given installation is the prerequisite for any meaningful financial impact assessment.
AR2 and AR3 CfD contracts: the six-consecutive-period threshold
Under CfD contracts awarded in Allocation Rounds 2 and 3, difference payments are suspended only when the Intermittent Market Reference Price (IMRP) — the wholesale market reference against which the CfD strike price is settled — remains below zero for six or more consecutive half-hourly settlement periods. That threshold equates to three consecutive hours of negative prices. If a negative-price episode lasts fewer than six settlement periods, the CfD top-up payment continues uninterrupted throughout. This relatively lenient threshold — broadly analogous to Germany's §51 EEG six-hour rule — means that many brief midday negative-price excursions do not trigger a suspension event for AR2 and AR3 generators. However, as the frequency and duration of negative-price episodes increases, the proportion of episodes that exceed the three-hour threshold is rising. Operators of AR2 and AR3 assets should monitor the duration of each negative-price sequence, not just the occurrence of individual negative-price periods, to determine when the suspension rule is engaged Frontier Economics — Impact of Negative Pricing on Renewable Support: CfD AR2/AR3 six-consecutive-period rule vs AR4 instant suspension.
AR4 and later CfD contracts: instant suspension on any negative period
Under CfD contracts awarded in Allocation Round 4 (2022 auction) and all subsequent rounds — including AR5 and AR6 — the difference payment is suspended for any single half-hourly settlement period in which the IMRP is negative, regardless of duration Frontier Economics — Impact of Negative Pricing on Renewable Support: CfD AR2/AR3 six-consecutive-period rule vs AR4 instant suspension. There is no minimum consecutive-period requirement. This is structurally stricter than both the GB AR2/AR3 rule and the EU Directive 2024/1711 approach (which broadly follows a six-hour model for EU member state support schemes). For an AR4 solar PV generator, every half-hour of negative wholesale prices is a half-hour of foregone top-up revenue — even if the episode lasts only 30 minutes. This design change significantly increases the commercial exposure of newer CfD assets to the growing frequency of negative-price hours. Revenue modelling for AR4 projects must account for the expected annual volume of negative-price settlement periods, not just negative-price hours, since GB settlement operates on a half-hourly basis. PV Watcher GB monitors the IMRP at settlement-period resolution and flags every period that triggers an AR4 suspension event, producing a documented record for revenue reconciliation and audit.
Renewables Obligation legacy assets: no suspension, but a different exposure
The Renewables Obligation scheme, which covers solar PV and other renewable assets accredited before March 2017, runs until 2037. ROC-generating assets receive one Renewables Obligation Certificate per MWh generated, regardless of the contemporaneous wholesale market price Ofgem — Renewables Obligation: scheme overview, RO certificates and accreditation register. Unlike CfD generators, RO assets face no direct suspension of support payments during negative-price periods. However, the absence of a negative-price penalty for RO generators also means there is no structural incentive for them to curtail output during negative-price episodes — and their continued generation directly contributes to the severity and frequency of those episodes. The commercial exposure for RO generators is indirect: negative-price periods may coincide with constraints or curtailment instructions from NESO's Balancing Mechanism that reduce actual generation volumes, and any energy sold in the spot market during negative-price periods generates a negative revenue contribution from the traded element. For any RO-era asset with a merchant trading element — for example, one selling in the spot market via a PPA rather than directly recycling ROC value through an obligation supplier — understanding negative-price exposure remains operationally relevant even though the ROC revenue itself is not at risk.
Expected revenue loss: modelling CfD difference payment suspensions
Quantifying the annual revenue impact of CfD difference payment suspensions requires three data inputs: the number of qualifying suspension events per year (for AR4, every negative settlement period; for AR2/AR3, sequences of six or more consecutive negative periods), the volume of generation in each suspension period (based on expected output from irradiation data and plant capacity), and the counterfactual value of the suspended difference payment (the gap between the CfD strike price and the IMRP in each period). PV Watcher GB combines ENTSO-E day-ahead price data ENTSO-E Transparency Platform — GB day-ahead half-hourly price data, plant-level generation estimates derived from irradiation at the installation location, and the project-specific CfD contract parameters to calculate this figure for any historical period. This calculation — sometimes called the 'lost revenue' or 'foregone difference payment' figure — is the primary metric for understanding the commercial sensitivity of a CfD solar PV asset to the continuing growth of negative-price hours in the GB market.
GB's national plant register and how to identify your installation
In Germany, the Marktstammdatenregister (MaStR) provides a single, publicly searchable registry of all generation installations with a unique identifier per asset. Great Britain's equivalent functions are distributed across several registers maintained by different bodies, but together they provide the information needed to formally identify, characterise and verify a solar PV installation — a prerequisite for any generation analysis that must hold up to regulatory or audit scrutiny.
Ofgem's Renewables and CHP Register: the RO and RHI asset database
Ofgem maintains the Renewables and CHP Register, the authoritative register of installations accredited under the Renewables Obligation and the Renewable Heat Incentive. The register contains installation-level data including accredited capacity, technology type, location (to distribution network operator area level), accreditation date and generating station identifier Ofgem — Renewables Obligation Accreditation Guidance and Renewables and CHP Register. It is publicly searchable via the Ofgem portal and provides the formal asset identity for any RO-era solar PV installation. Accreditation status in this register determines eligibility to generate ROCs; an installation whose accreditation is suspended loses its entitlement to ROC issuance for the period of suspension. For operators of multiple RO assets, cross-referencing the Ofgem register with half-hourly metered generation data is the standard method for verifying that all accredited stations are generating as expected and that any shortfall from expected generation is properly attributed.
CfD Register and LCCC reporting: CfD asset identity and settlement
CfD generators are registered with the Low Carbon Contracts Company (LCCC), the government-owned counterparty to all CfD contracts. Each CfD asset is assigned a unique CfD Reference Number, and settlement data — including metered generation volumes, IMRP values and difference payment calculations — is published by LCCC at asset level with a short delay Frontier Economics — Impact of Negative Pricing on Renewable Support: CfD AR2/AR3 six-consecutive-period rule vs AR4 instant suspension. The LCCC settlement timetable produces monthly reconciliation statements; PV Watcher GB cross-references these statements against our own negative-price event log to verify that suspension events have been correctly identified and that the corresponding difference payment adjustments match the volume of generation in affected periods. NESO also maintains the Balancing Mechanism Elexon portal (BMRS — Balancing Mechanism Reporting Service), which publishes half-hourly metered generation data for all registered BM Units and provides the settlement-period-level generation record that underpins any detailed CfD revenue analysis.
Expected generation (target output): the basis for curtailment monitoring
The German engineering concept of Soll-Erzeugung — the theoretically expected generation based on irradiation and design parameters — has a direct functional equivalent in GB solar PV monitoring. Expected generation for any period can be modelled from: the plant's installed capacity (kWp), module orientation and tilt, system-level losses (soiling, shading, wiring, inverter efficiency), and irradiation data from the UK's Met Office or European satellite-derived datasets such as PVGIS (the European Commission's Photovoltaic Geographical Information System) or CMSAF SARAH-3 reanalysis data. The difference between modelled expected generation and actual metered output — after adjusting for planned maintenance and genuine equipment outages — is the volume of generation that can be attributed to curtailment (either due to negative market prices or due to a system operator instruction). PV Watcher GB uses this expected-versus-actual comparison as the primary signal for identifying curtailment events, and expresses the result in kWh per event, annual MWh, and in monetary terms based on the relevant contract or market price applicable to each period.
How PV Watcher GB detects and quantifies each curtailment event
Automated detection of curtailment events — whether from negative market prices or from NESO Balancing Mechanism instructions — requires the real-time integration of three data streams: half-hourly day-ahead settlement prices published on ENTSO-E and confirmed in EPEX SPOT or N2EX market data, NESO BM dispatch instructions and constraint notifications, and the installation's own metered generation data. PV Watcher GB integrates these three sources to generate alerts, quantify financial impact and produce the documentation needed for revenue reconciliation, audit or regulatory submissions.
ENTSO-E and market data integration: detecting settlement-period thresholds
N2EX and EPEX SPOT publish day-ahead prices at half-hourly resolution; ENTSO-E's Transparency Platform aggregates this data and makes it available via API ENTSO-E Transparency Platform — GB day-ahead half-hourly price data. PV Watcher GB ingests half-hourly IMRP values and identifies, in real time, whether each settlement period contains a negative price. For AR4 CfD assets, every negative settlement period triggers a logged suspension event. For AR2/AR3 CfD assets, the system monitors sequences of consecutive negative periods and raises an alert when the fourth consecutive negative period is detected (giving the operator two periods of warning before the six-period threshold is reached). When the threshold is met, the system records the start and end of the suspension sequence, the minimum price reached, and the volume of expected generation during the episode. This log is the basis for revenue loss quantification and for reconciliation against LCCC settlement statements Frontier Economics — Impact of Negative Pricing on Renewable Support: CfD AR2/AR3 six-consecutive-period rule vs AR4 instant suspension.
Actual versus expected generation: the core monitoring signal
Quantifying lost revenue requires comparing actual metered generation — obtained from the installation's revenue-grade meter via ELEXON's data collection infrastructure or directly from the plant SCADA — against the modelled expected generation curve for each half-hourly period. Expected generation is calculated from irradiation at the plant location (using Met Office or CMSAF satellite irradiation data at hourly resolution), adjusted for the plant's performance ratio and module degradation factor. The difference between the expected curve and actual generation during periods identified as curtailment events is the volume of undelivered energy. PV Watcher GB expresses this in kWh per event, cumulative MWh per month and year, and in pounds sterling, applying the counterfactual CfD difference payment value or the relevant market price for merchant generators. No lost-revenue figure is generated without a corresponding metered generation record; figures derived solely from modelling are clearly labelled as estimates.
Proactive alerts and the event dashboard
Once the system detects that the IMRP has been negative for two consecutive half-hourly periods, PV Watcher GB issues a preventive alert to the asset operator or O&M manager. For AR4 CfD assets, this alert triggers immediately on the first negative period. For AR2/AR3 assets, the alert at the four-period mark provides time to activate any co-located battery storage, contact the trading counterparty, or simply ensure that the unfolding event is captured in the documentation record before the threshold is crossed. The historical event dashboard shows, for each episode: date and time of start and end, duration in settlement periods and hours, minimum price reached, energy affected in kWh, and regulatory classification (AR4 suspension, AR2/AR3 below threshold, AR2/AR3 above threshold, or Balancing Mechanism curtailment). All events are exportable in CSV format for use as supporting evidence in LCCC settlement queries, Ofgem regulatory submissions, or investor and lender reporting under the financial model of the project.
Balancing Mechanism curtailment: the second vector of generation loss
Negative-price market events are not the only source of unplanned generation shortfall for GB solar PV assets. NESO may issue Bid acceptances in the Balancing Mechanism that instruct a generator to reduce output below its physical capability — effectively curtailing generation for network constraint reasons rather than purely for price reasons. Unlike mandatory uncompensated curtailment in some continental European jurisdictions, GB Balancing Mechanism curtailment is compensated at the accepted Bid price. However, the Bid price accepted by NESO may be lower than the generator's reference revenue, resulting in a net revenue shortfall. PV Watcher GB detects BM curtailment events by comparing expected generation against metered output at times when the half-hourly price does not indicate a market-driven response — a sudden output reduction that is not explained by irradiation, temperature or equipment status points to a BM instruction. The system cross-references this hypothesis against NESO's published Balancing Mechanism Reporting Service (BMRS) data, which records accepted Bid and Offer volumes at half-hourly resolution for all registered BM Units NESO / ELEXON — Balancing Mechanism Reporting Service (BMRS): half-hourly generation, Bid/Offer volumes and constraint notifications.
From data to pounds: how foregone revenue is calculated
PV Watcher GB does not stop at event detection. Its distinctive value lies in converting technical data into verifiable financial figures that are useful both for internal asset management and for any regulatory, audit or transaction due diligence process. All financial calculations are built on metered data and published price sources; figures derived from modelling assumptions are clearly labelled as estimates.
Methodology for calculating foregone revenue
Foregone revenue per curtailment event is calculated as the product of the volume of undelivered energy (expected generation minus actual generation in kWh) and the applicable revenue rate for the affected settlement periods. For CfD generators, this rate is the CfD difference payment that would have applied had the price not been negative: the gap between the project's strike price (indexed to CPI in line with the CfD contract) and the IMRP in the period immediately before the negative episode. For merchant generators selling under a PPA, the applicable rate is the contracted PPA price or, in the absence of a fixed contract, the prevailing half-hourly market clearing price. PV Watcher GB applies the correct rate automatically based on the registered contract type of each monitored installation, ensuring that the foregone revenue figure is methodologically consistent with the applicable regulatory framework. Annual aggregated figures provide the cumulative financial impact, comparable period-to-period as the frequency of negative-price events evolves.
Adjusting expected generation for degradation and availability
The expected generation of a solar PV installation is not static: it decreases progressively due to module degradation — typically 0.4–0.7% per year for crystalline silicon modules according to published manufacturer data — and may be affected during individual periods by planned maintenance, inverter faults or grid outages that are not attributable to market conditions or system operator instructions. PV Watcher GB applies a declared availability correction: if the operator reports that an inverter was offline during a curtailment event, those periods are excluded from the foregone revenue calculation to avoid attributing internal plant failures to external curtailment. This correction mechanism is essential for maintaining the credibility of the analysis under audit: figures must reflect only the revenue loss attributable to market prices or NESO dispatch, not losses from the installation's own operational issues. The platform maintains a log of all availability declarations and their effect on the calculated figures, providing full transparency for any external review.
Documentation for LCCC settlement queries and regulatory submissions
LCCC CfD settlement statements are issued monthly and may be queried through the LCCC dispute resolution process within defined timescales. PV Watcher GB generates an event report for each negative-price suspension episode in a format structured around the data fields relevant to LCCC queries: CfD Reference Number, metered generation volume by settlement period, IMRP value by settlement period, calculated difference payment before and after suspension, and the documentary basis for the expected generation figure used in the loss calculation. Similarly, Ofgem's Renewables Obligation reporting framework requires generators to maintain records of metered generation and accreditation compliance; the PV Watcher event log provides an auditable trail of any periods in which generation deviated materially from the accredited installation's expected output. All event data is exportable in structured CSV and PDF formats suitable for direct submission to LCCC, Ofgem, or lender technical advisers conducting periodic asset performance reviews Ofgem — Renewables Obligation Accreditation Guidance and Renewables and CHP Register.
- ENTSO-E Transparency Platform — GB day-ahead half-hourly price data
- Frontier Economics — Impact of Negative Pricing on Renewable Support: CfD AR2/AR3 six-consecutive-period rule vs AR4 instant suspension
- Ofgem — Renewables Obligation: scheme overview, RO certificates and accreditation register
- Ofgem — Renewables Obligation Accreditation Guidance and Renewables and CHP Register
- NESO / ELEXON — Balancing Mechanism Reporting Service (BMRS): half-hourly generation, Bid/Offer volumes and constraint notifications
- Energy Storage News — GB negative-price hours 2024: six-fold increase to ~139–149 hours versus 2022
Start monitoring your GB solar PV asset today
PV Watcher GB connects to your installation's generation data in less than 24 hours. No complex integration required: you need only your CfD Reference Number or RO accreditation number and access to your half-hourly metered generation data. Our team will advise on the applicable negative-price rule for your contract type and configure alert thresholds to match. The first event report is available from day one. Contact HR Energiemanagement GmbH: +49 5223 4921030.
Was kosten dich die Negativstunden?
Bei negativen Boersenpreisen bricht die Verguetung weg. Pruefe mit deinen Daten, was dich das kostet.
Meinen Verlust pruefen →